


Though the postmodern, globalized world has forced us to dispense with the idea of universal values or truths, there is one thing all human societies still share: stories. For millennia, humans have told stories to make sense of their place in the world. We’ve conjured elaborate creation myths. We’ve turned the dry facts of history and science into dazzling fables of change and progress. Even our identities are narratives of a sort, our kaleidoscopic memories an ever-changing tale in which we are the central character.
Now, in the early 21st century, we make charts and put them on the Internet. Websites are crammed with infographics. We can map our checkins on Foursquare or visualize our music listening habits. If we once apprehended life through text, in what is perhaps a return to our roots in cave paintings and hieroglyphs, we now increasingly rely on pictures and graphics.
In light of the change, it would be easy to drag out one’s typewriter, bang out an angry screed about how nobody reads anymore, and deliver it to the nearest newspaper — preferably on horseback. But data visualization, as it’s called, is far from some sort of crass, simplistic response to modern pressures on attention spans. Quite the contrary, 3D graphs, interactive digital maps and infographics are opening up new ways of looking at the world.
Unlike many digital trends, data visualization isn’t a practice dominated by one or two companies. Instead, its mixture of math, design and programming is becoming a field unto itself, changing everything from the practice of journalism to the use of government information to how advertising works. And if the 20th century saw us slowly awake to the persuasive effects of written and spoken language, the 21st is making us deal with the rhetoric of the visual.
Patricio Davila spends a lot of time thinking about this. When he’s not teaching at Toronto’s OCADU, he’s working on a PhD in Communication and Culture, with a focus on critical design and data visualization, at York University. Though, like most academics, he’s reluctant to land on a simple definition, he’s most comfortable when he thinks of data visualization as a way of setting up a relation between bits of information.
“In data visualization, information is a space,” he says over coffee in Toronto’s west end, “where data sets and data points are visualized in a way that invites comparison.” Of course, we’ve used charts and graphs to do this for centuries. I think I may have made one myself in crayon, probably about the number of toys I owned. But modern technology has made the practice of collecting and then comparing data pregnant with possibility.
“This is coming together in a very real way because of computation,” Davila says. “In computation, you can reduce things to comparable units, like counting people walking down the street, and the number of streetcars. Once you reduce things to data sets, you can compare, and that’s when things become really interesting.”
It’s then, after all, that you can crunch millions of bits of information to arrive at useful insights, like what people are watching online, say, or the links between voting habits and household income. Yet that capacity to abstract and analyze is only one half of the modern data equation. The near ubiquity of ways of collecting information — cellphones with GPS tracking and cameras, sensors on highways, satellites — is the other, and a fact that means we now have a flood of data, often in numerical and statistical form.
“Companies, governments, and activist organizations all collect as much data as they can,” Davila says, “because, at some point, there might be a correlation between things we hadn’t seen before.” It’s that capacity to see things in new way that is most promising about data visualization. Written language, by its very nature, has a kind of linear force that convinces you of something in a cumulative manner – just like the paragraph you’re reading right now. But because digital graphs and maps let you enter information from any point and correlate them as you wish, cleverly designed “data viz” can do a lot to change people’s minds because it presents a new perspective from which to see things.
This is at the core of the work of journalist Patrick Cain. He’s become an expert in digital maps, and has created a huge audience for them at the Toronto Star, OpenFile and now at Globalnews.ca.
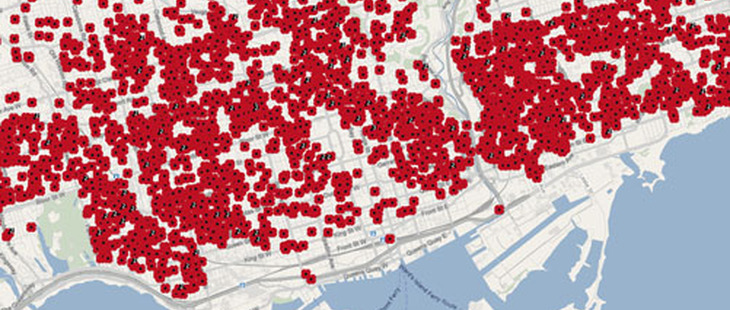
Beyond the obvious advancements in the technology, what prompted Cain to start tinkering with Google Maps was the unique things it let him do. “I had a number of ideas which I never totally thought would work as conventional print story ideas, but worked as maps,” he says. As an example, he offers up one of first maps he created, which mapped dog licenses around the city of Toronto, allowing people to see which breeds were popular where. It was the kind of story that would have been a bit dry and trite if written out, but as a interactive map you could click on, was as serious or as fun as the reader wanted it to be, and proved quite popular. By the time his Toronto Star maps blog closed, it had amassed 1.4 million page-views.
As it turned out though, the interactive maps could be much more than just entertainment. “The really effective way of marketing them was to link to a related story on the site,” says Cain. “So, for example, we had a map of drunk drivers by postal code with a story about impaired driving.”
But delving into the world of data, most often through freedom of information requests, let Cain stumble upon and then publicly present some interesting facts. Who knew, for example, that Toronto has a surprisingly high rate of gonorrhoea infections, or that the city has the lowest rate of organ donation in the province? If, in some ways, data visualization is a way of delivering information, in its practice and methods, it sometimes becomes a way to discover it.
Stumbling upon new ideas like that, however, presents its own problems. As Cain points out in reference to the high number of sexually transmitted diseases, telling a story when you only show the what — but don’t explain the why or the how — doesn’t exactly lend itself to compelling writing. Yet at the same time, it’s valuable for people to know their neighbourhood has a high rate of STDs.
“Data mapping lets the reader ask their own questions of the data, based on their own curiosity, their own agenda, their own neighbourhood,” says Cain. Rather than being told or shown what their interpretation of media should be, data visualization is a tool to allow people to create their own.
In a sense then, all these maps and charts and graphs are still telling stories. Giving readers more access to raw data lets them produce their own narratives in micro, reconfiguring their relationship to data in a way that isn’t entirely controlled by what they’ve heard before. Making narratives, even of numbers, is just what humans do.
There is a great deal of promise in that idea. Take, for example, Universe, a visualization tool that carries the tagline “revealing our modern mythology.” The interactive site lets you enter a word and then presents you with an array of ways to consider all the terms, news stories and pictures linked to it, visually arranged in a constellation. Type in “Toronto” and you’ll be presented with a few hundred related words, each of which you can click on, and which themselves will then send you spinning off in any number of ways.
There is no story to it, no implied meaning, and no overarching ideological bent. It is, in many ways, quite blank. But that blankness dislodges us from familiar ways of seeing. And rather than a story we’ve heard many times before, at its best data visualization gives us a network of relations, endlessly reconfigurable, full of the hope that through it we may discover something new.